Design, Science and Technology
45.8K views | +3 today
Follow
Design, Science and Technology
#ideas #design #science #technology #inspiration #media #information
Your new post is loading...
Rescooped by Antonios Bouris from visual data
Scoop.it!

Schematic of Structures: Charting History's Most Significant Works of Architecture

Schematic of Structures: Charting History's Most Significant Works of Architecture | Design, Science and Technology | Scoop.it

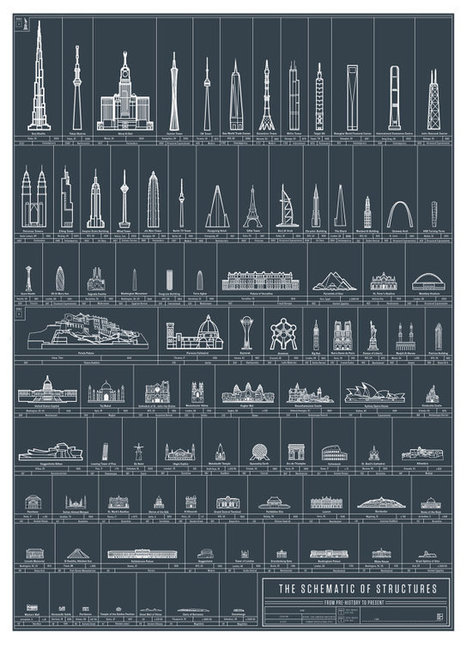
Yet another creation has rolled off the powerhouse infographics assembly line over at Pop Chart Lab, and this time, the indefatigable taxonomizers of alcohols and famous quotes have turned their attention to works of architecture.

The Schematic of Structures organizes what the designers describe as "90 eminent edifices erected and perfected throughout history." Arranged by height, the infographic lines up some of the greatest works envisioned and built by man since prehistory, from the Neolithic Cairn of Barnenez and the Parthenon to more modern creations like London's Gherkin and the Burj Khalifa.


Via Lauren Moss
No comment yet.
Rescooped by Antonios Bouris from visual data
Scoop.it!

A Perspective on Time | Visual.ly

A Perspective on Time | Visual.ly | Design, Science and Technology | Scoop.it

'Humans are good at a lot of things, but putting time in perspective is not one of them. It's not our fault - the span of time in human history, and even more so in natural history, are so vast compared to the span of our life and recent history that it's almost impossible to get a handle on it.'

View the information sources and data here.


Via Lauren Moss
No comment yet.
Rescooped by Antonios Bouris from visual data
Scoop.it!

A Visual History of Computing [Infographic]

A Visual History of Computing [Infographic] | Design, Science and Technology | Scoop.it

Exactly 70 years ago this month the world’s first electronic programmable digital computer was created. It was called Colossus and was engineered in the UK by code breakers working during the Second World War. 

Computers and their uses have changed significantly over the past 70 years – primarily government machines quickly proved their worth in the business landscape, and more recently they have become commonplace in homes too.

Akita, a London IT support company has produced a large interactive page and infographic to showcase the developments in technology. It can be viewed in full here: http://www.akita.co.uk/computing-history/ or as a static image at the link.


Via Lauren Moss
No comment yet.
Rescooped by Antonios Bouris from visualizing social media
Scoop.it!

Infographic: The history of online advertising

Infographic: The history of online advertising | Design, Science and Technology | Scoop.it

Advertising has come a long way since the first ever online ad was sold in 1993.

This new infographic from Marin Software plots the industry's biggest moments, from the launch of Facebook to Twitter's promotional tweets and the more recent introduction of Google Adwords.


Via Lauren Moss
9Dotstrategies's curator insight, October 3, 2013 4:24 AM

History of Online Advertising: An Infographic

Jagadish Pokhrel's curator insight, October 4, 2013 12:54 AM

what's up next?

Lee Werrell's curator insight, October 6, 2013 6:47 AM

Just shows the phenomenal growth of online activity - and it is set to grow exponentially as more peoiple access the internet.