 Your new post is loading...
I’ve never met anyone who dreamed of integrating EHR software or auditing SOX compliance as a child. And I certainly don’t recall my mother sewing together a B2B content marketer costume for my first Halloween.*
But we’re actually in excellent company. The trouble is, however, your business can no longer rely on boring, boilerplate text to fill its funnel. That’s why I’d encourage you to spice up your content cookbook with a bit of infographic marketing. ,*It was a Peter Pan costume, and it was flawless.
Why do infographics outperform vanilla text?...
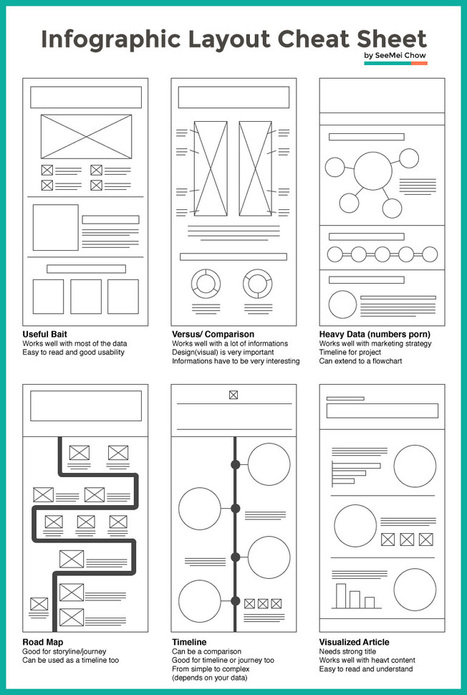
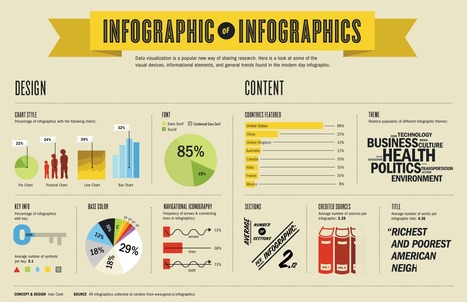
Infographic layouts refer to the arrangement of your visual elements and your content. When you begin working on a piece of infographic, you should have a story to tell hence, you will need to select a layout that best suits your story. Using the right layout will ensure good readability and convey your message well.
We have put together a cheat sheet for your quick reference to the right arrangement to use, here are six common ones you can quickly work with....
Are you curious about what's going to happen in the next billion or so years? Well, lucky for you, we have an infographic to let you know every important event from now until then—and the next billion years after that, too.
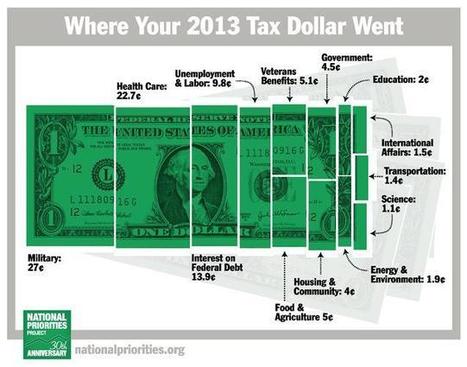
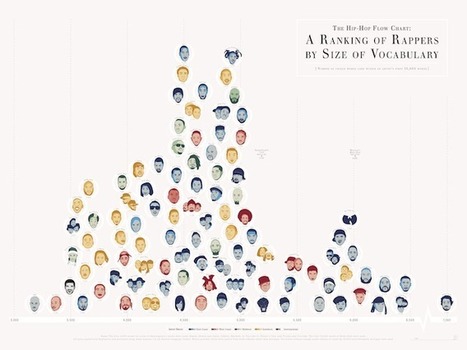
We can also show you how to eat healthy and explain your taxes to you. These are just a few of the most informative and fun infographics, visualizations, and other graphic stories that we've seen over the last year.
So pour over these charts and learn a little something (and, while you're at it, you can take a look at the ones we featured last year):
Sometimes you’re surfing around the web and you notice some really cool infographic on something like fashion, music, or food, and you can’t help but wish that you could create something like that; even if it’d take you a week.
Well, I’m here to tell you that it’s definitely possible to create some awesome infographics in any category that you choose, EVEN if you’re not a designer. In this blog post, I’m going to introduce you to three awesome tools to create the best infographics, tell you how to use them AND how you can share your infographics in different channels all over the web. So, let’s get started!
Every year people proclaim the death of something or other in marketing -- and the death of the infographic doesn't escape conversation. It's probably because while more people have caught on to the power of infographics for communications or marketing initiatives, not all of them are doing it well -- so it's hard to separate the wheat from the chaff.
These 15, however, managed to stand out. My criteria here were not scientific. I looked for infographics that I simply could not stop reading til the very end -- or in the case of the interactive ones in the latter half of this post, the ones I couldn't stop exploring. Enjoy perusing the best of what 2014's infographics had to offer, ranked in no particular order (except for #1 -- I love #1)....
Infographics are a great way to present a wealth of information on social media, without overwhelming your audiences. This visual trend of data visualization is just getting warmed up, as more and more companies are sharing vital pieces of information in layers and sub layers of an Infographic.
As 2014 is coming to an end, and before we ring in the New Year. I’ve decided to share with you a list of 10 best infographics of 2014, which share such valuable insights on various facets of social media marketing which are vital to know before you say goodbye to this year!...
“Content is the new SEO” has been one of the resounding slogans guiding marketers in 2014. As you know, it’s not just enough to churn out content — writing about whatever is on your mind… often. You need to have an overall strategy in mind, too....Still not convinced? Here are 8 reasons to hire an SEO content strategist....
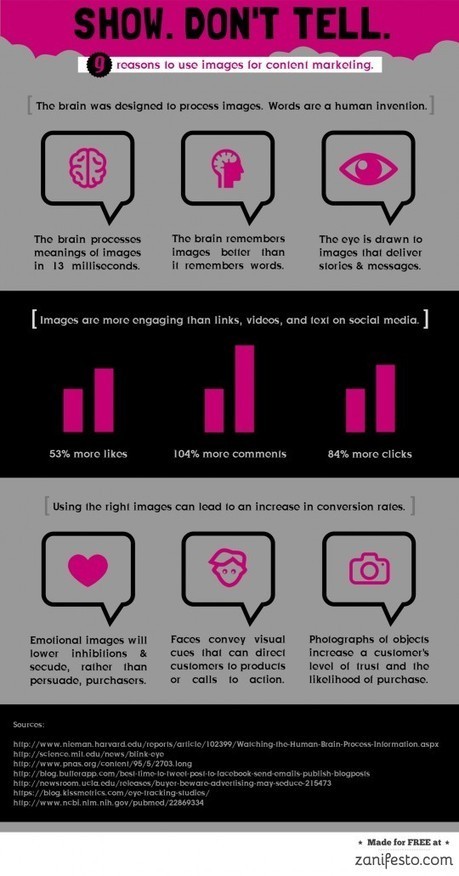
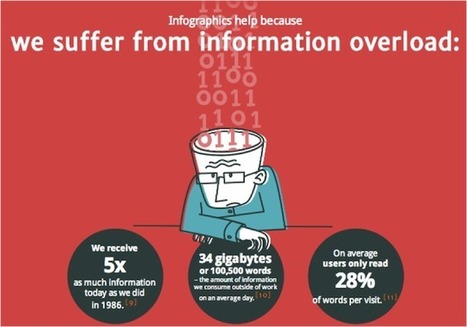
Infographics are everywherebut what made them so successful?This infographic exposes the science behind the boom....
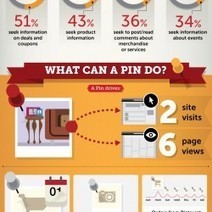
Pinterest was once an internet secret; with its beta version only available by invite, millions were clamoring for an exclusive invite. Now, however, the site has become a social media heavyweight....
We all know that images are compelling. The growth of visual content has been on a rapid upward trajectory over the last 12 months.
Social media platforms such as Pinterest and Instagram have taken the social media world by storm.
Instagram announced in July that it had acquired 80 million users. To put some further perspective on its adoption and growth, the visual social media network is now being used by 40% of the worlds top 100 brands.
Compete.com recently released a report showing that Instagram was the fastest growing web property on the planet amongst the top 50 websites. The report stated that it had grown from 16 million to 22 million unique visitors in just one month, which is a growth rate of 38% in just 30 days!...
Visual social media posts get more engagement than text, but this rule goes for all content marketing pieces.
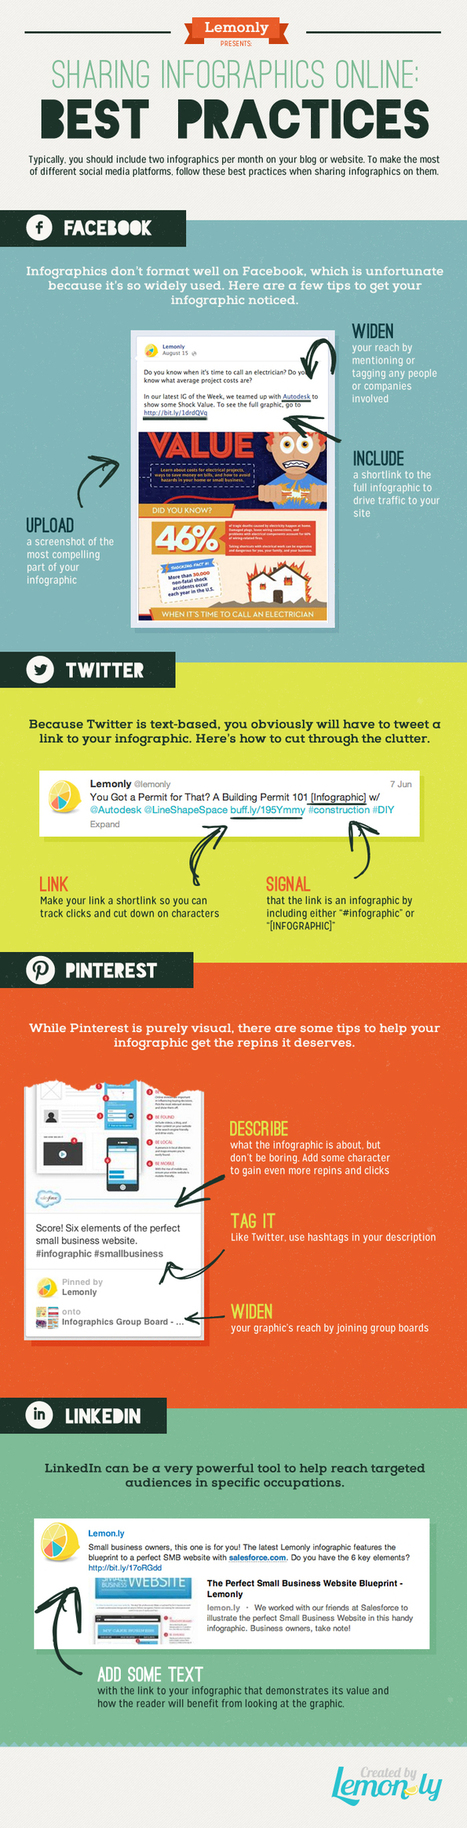
Sharing your infographic that’s hosted on your website/blog and engaging the social sharing potential is key to maximizing the work you put in to creating your infographics. Each social network has different image display requirements. For example, tall infographics do not present well on Facebook. Facebook outlines horizontal images and a ratio of 1200 w x 627 h, meaning you may need to create some sharing images to drive social viewers to the main infographic.
The team at Lemonly put together a great infographic covering keys for social sharing on: - Facebook
- Twitter
- Pinterest
- LinkedIn
Have a look and bookmark for future reference...
Via Lauren Moss, Jeff Domansky
9 informative infographics to help guide your visual content marketing, explaining why we love images and videos in the content we read, share, and enjoy.
|
Well, I’m here to tell you that it’s definitely possible to create some awesome infographics in any category that you choose, EVEN if you’re not a designer. In this blog post, I’m going to introduce you to three awesome tools to create the best infographics, tell you how to use them AND how you can share your infographics in different channels all over the web. So, let’s get started!..
We live in an age of Big: Big Computers, Big Data, and Big Lies.
Faced with an unprecedented torrent of information, data scientists have turned to the visual arts to make sense of big data. The result of this unlikely marriage—often called "data visualizations" or "infographics"—has repeatedly provided us with new and insightful perspectives on the world around us.
However, time and time again we have seen that data visualizations can easily be manipulated to lie. By misrepresenting, altering, or faking the data they visualize, data scientists can twist public opinion to their benefit and even profit at our expense.
We have a natural tendency to trust images more than text. As a result, we’re easily fooled by data visualizations. But fortunately, there are three easy steps we can follow to save ourselves from getting duped in the data deluge....
Have you ever wondered when you should be sharing your content on the social web?
Your visitors and followers prefer using social media sites during specific hours. So if you start sharing your content when your users are on these social sites, you’ll not only gain more shares, but you’ll also notice an increase in traffic.
So, when should you be sharing your content? Well, just follow the times in the infographic below....
VMonths back we came up with the superb collection of nice, visually appealing infographics (Creative Infographics for Designers and Developers) witnessing which designers and developers would easily relate as each one of them was visual graphics talking about designers and developers.Here is our latest compilation 40 creative infographics for designers and developers. Hit a jump to take the glimpse of each....
We all know a picture speaks thousand words and for that reason infographics are being more popular due to its amazing information displayed in the form of images. It has the capability to capture everyone’s eye and tell them a story with engaging content and images. It’s an all in one package with text, images and creative design that come all along. It holds a great marketing potential that has the ability to attract customers. Many people click on infographics as it is more appealing and hence your web traffic is increased which is beneficial aspect for SEO.
Here we have the collection of 10 interesting infographics about social media. Let’s have a look at them below.
If you’re anything like me, you learned how to use programs like Photoshop and Gimp out of necessity to do minor changes to photos. You might have even dabbled in some easier graphic design projects for your own website, but it takes you hours to get the image or the design looking just right and you’re left exhausted. You might even spend time looking up tutorials on how to achieve a certain effect and still have trouble re-creating it.
In short, while you do know your way around the programs like Photoshop to a certain extent, it takes you forever and there’s absolutely no way you’d call yourself a graphic designer. But then, you’re surfing around the web and you noticed some really cool infographics on things like fashion, music and food and you can’t help but wish that you could create something like that; even if it’d take you a week....
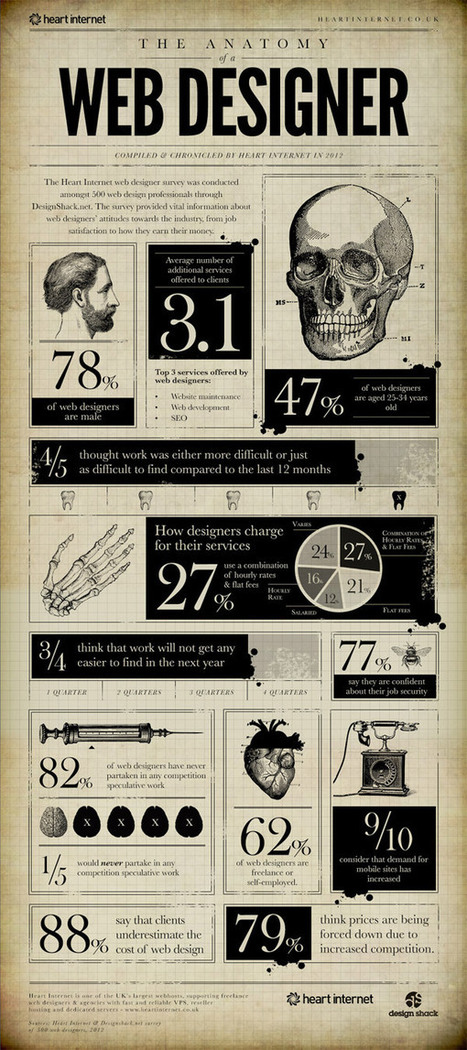
The bold visual design of Infographics makes it easy to digest facts and figures about a given subject. There’s some great infographics based on interesting topics related to web design, from articles explaining the benefits of responsive design to interesting statistics about the industry. Today I showcase 15 interesting Infographics that every web designer will enjoy. Give your scrolling finger some exercise as you browse through this lengthy post!...
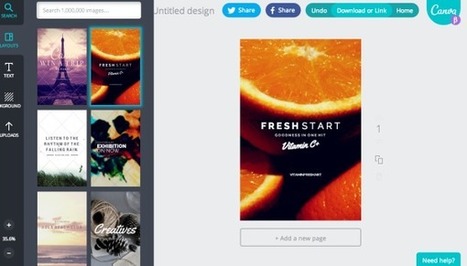
Creating infographics using online tools has never been easier. In the last few years a number of online tools have emerged that allow anyone to create great visual content. Whether you are working on a project for work, personal use, or social media, each new project starts with a template. With the dimensions laid out for you, you can focus your attention on quickly creating effective designs. Search, drag, and publish - it can be that simple.
These new tools are vector graphics applications that run in your browser as a replacement for using an expensive professional desktop application like Adobe Illustrator to put your infographic design together. Each one offers different tools, image libraries, charts, fonts and templates as a starting point. None of these have the full capabilities of a professional desktop application, but you probably don’t need that much power to create a simple infographic.
In this article, we take a quick look at 5 of the best online tools for creating infographics: Visme, Canva, Easel.ly, Piktochart, and Infogr.am. All of these tools are evolving quickly, and this is just a snapshot of their current capabilities.
A few weeks ago here on Copyblogger, Demian Farnworth presented the infographic as the Salvador Dalí of content marketing — the most interesting person at the cocktail party.
More than just a superficial presence, an infographic is a significant asset pillar with diverse possibilities that help you grow your media empire.Today, let’s equate the Internet to the world of pop music. In this case, infographics are The Beatles....
Are you ready to use infographics in your social media marketing?
Do you know how to get started?
Creating infographics is getting easier. When you illustrate a concept with images, you’re likely to find a bump in social media visibility.
In this article you’ll discover how to create and promote infographics to put your content front and center....
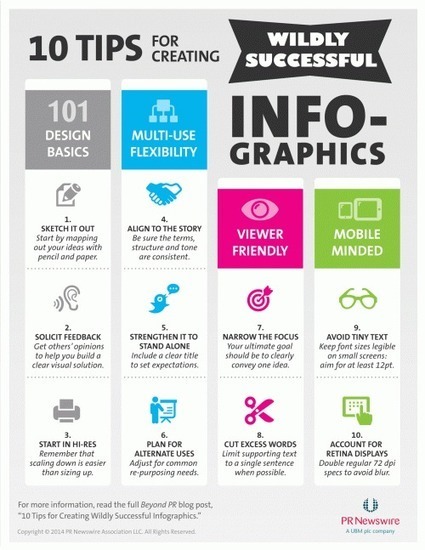
Infographics are playing a larger role in visual storytelling efforts. When they are thoughtfully designed, they provide attention-grabbing visuals that also help the reader better comprehend and remember the message. This added value to the reader often encourages further engagement and sharing.
Based on my experience creating infographics that are used in PR Newswire’s press releases, blog posts and presentations, here are some best practices for designing infographics that drive results....
Finding the newest way to get you brand in front of an audience these days can be challenging. There’s tons of brands utilizing different marketing efforts to get their product in front of potential customers.
There’s blog posts, infographics, videos, and more.However, there’s a new player in town, and it’s an online interactive. Brands are jumping on the interactive bandwagon, and honestly, some of the stuff that’s being put out there is amazing!
What are Interactives?
Essentially at the end of the day, an interactive is pretty much an infographic that you can interact with. Interactives are the most effective method of displaying limitless chunks of data or information in a clean, correlated, and engaging format....
|


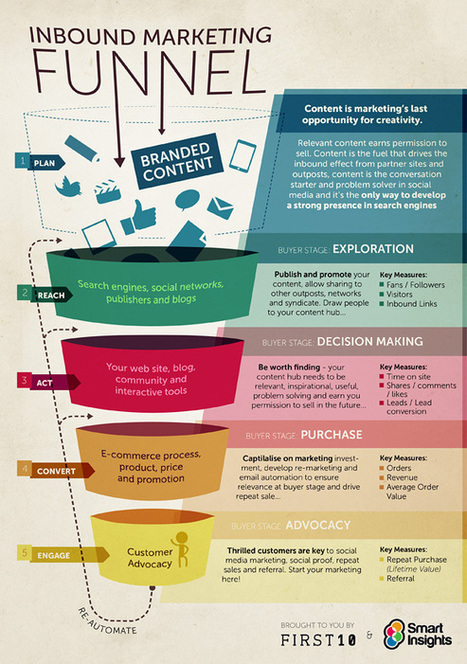


Infographic marketing can help any business - no matter how technical or niche - spice up its web presence with attractive visuals that tell an interesting story.